Cancer Epidemiology · J Clin Oncol (ASCO 2026) · 2026
The Brain Tumor After the Blood Cancer
The Scenario
Survive a blood cancer, and years later a brain tumor may follow. Coincidence or consequence? A registry of more than 830,000 patients can tell the difference.
The question needed three separate answers: is the incidence truly elevated, which treatments raise it, and what happens to survival once it occurs. Each answer needed a different statistical machine, and the second two needed protection from a subtle trap.
From Question to Answer
Clinical question
Do hematologic malignancy survivors develop CNS tumors more often than expected, and who is at risk?
The evidence
SEER 2000 to 2022: linked primaries for more than 830,000 patients
The design
Standardized incidence ratios, Cox models, and Fine-Gray competing risks, with latency stratified by treatment
The answer
Quantified excess risk with treatment-specific patterns; ASCO 2026, full paper in revision
The Decisions That Mattered
Standardized incidence ratios against population expectation.
Raw counts cannot say whether risk is elevated. MP-SIR compares observed CNS tumors with what the general population would produce in the same person-years.
Fine-Gray, because death competes with diagnosis.
Many survivors die before a second tumor can appear. A naive Kaplan-Meier treats them as if they might still develop one and overestimates the risk. Competing-risks regression does not.
Latency stratified by prior treatment.
Radiation and chemotherapy leave different fingerprints in time. Analyzing when the second tumors arrive, by exposure, is what separates consequence from coincidence.
The editor pushed on the cohort definition. The revision answered with the data.
Peer review challenged how linked primaries were defined. The point-by-point response defended and refined the definition rather than papering over it.
Overview
Problem
Whether second primary CNS tumors after blood cancers reflect true excess risk, and what drives it.
Approach
SEER MP-SIR, cause-specific Cox, and Fine-Gray competing-risks regression with treatment-stratified latency.
Outcome
Presented at ASCO 2026; the full manuscript has completed its first peer-review revision round.
Figures
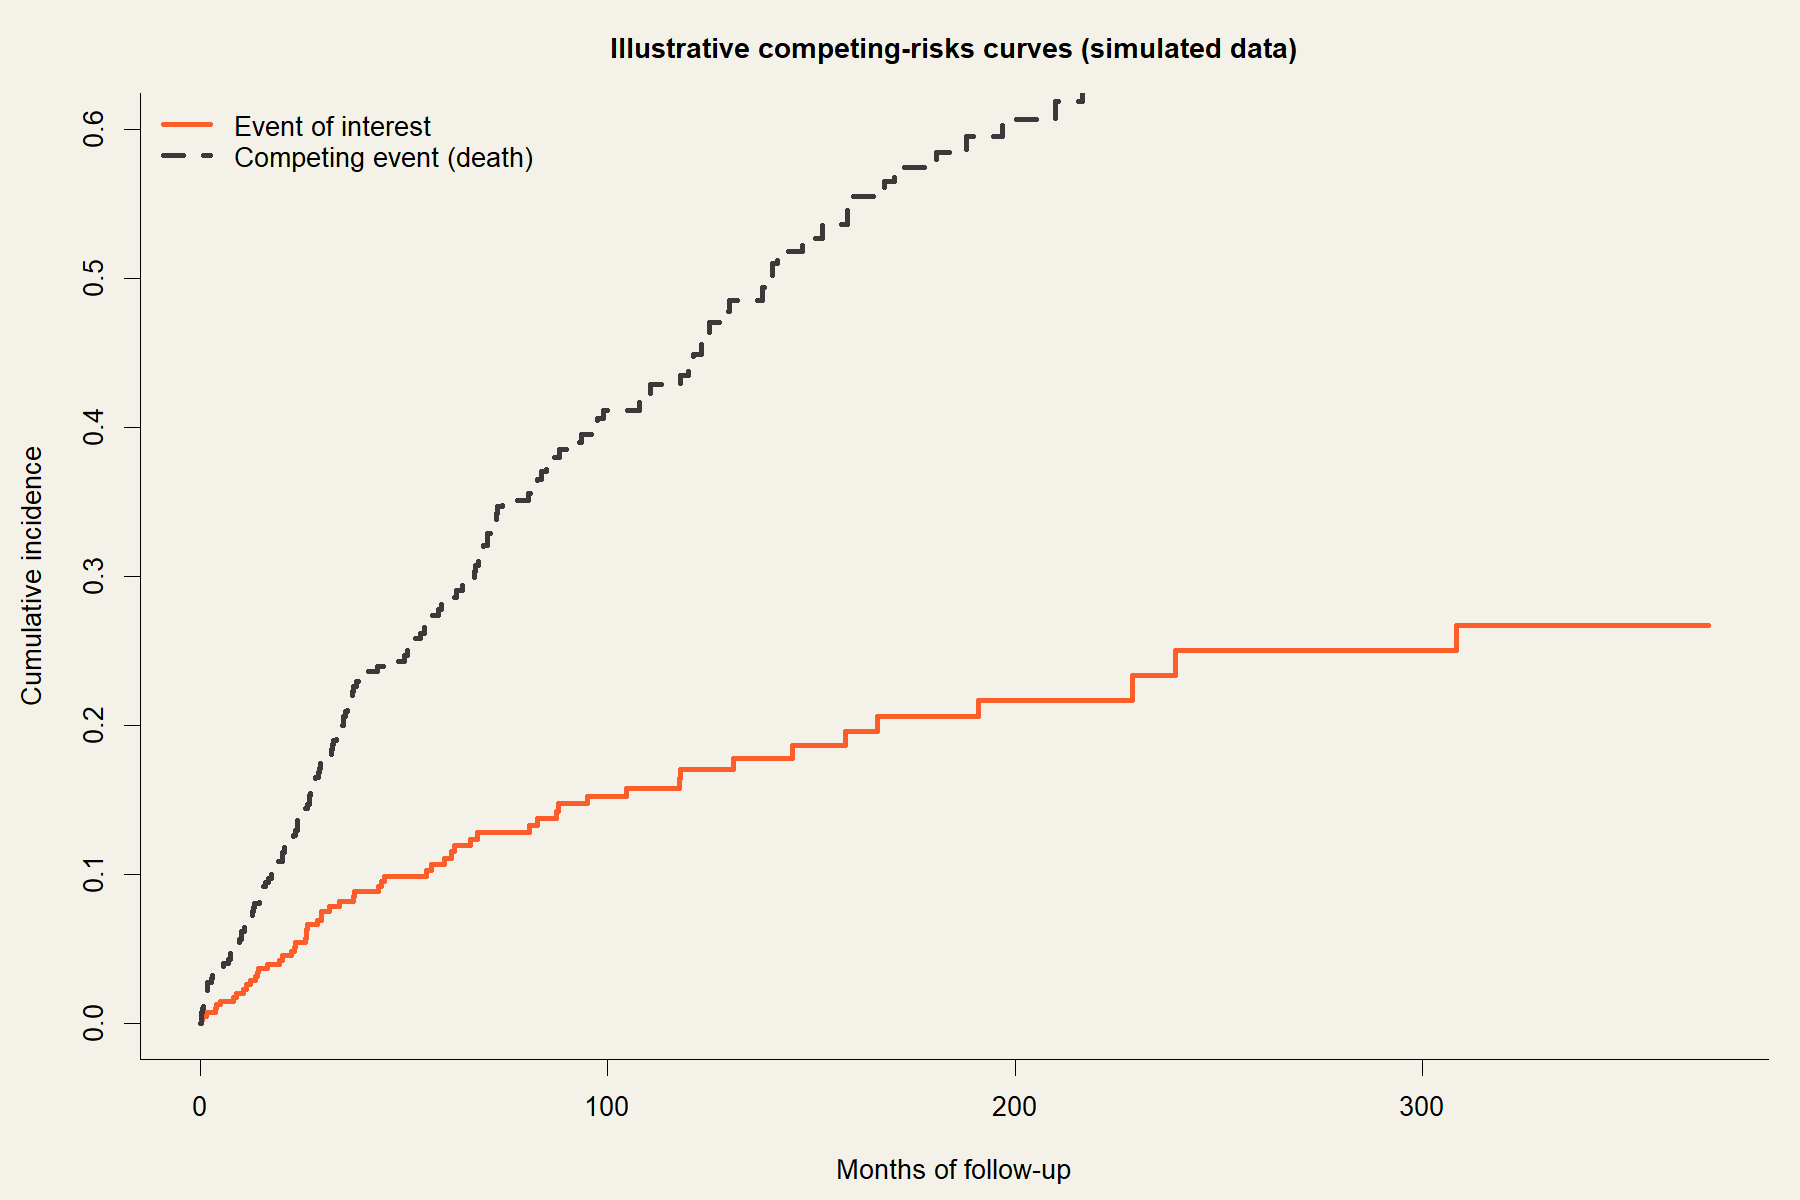
Reproducible R Code
Two hazards, two questions
# Cause-specific hazards: Cox on the event of interest
cox <- coxph(Surv(months, cns_event) ~ age + sex + radiation + chemo,
             data = cohort)

# Subdistribution hazards: Fine-Gray, death as competitor
fg <- crr(ftime   = cohort$months,
          fstatus = cohort$status,     # 1 = CNS tumor, 2 = death
          cov1    = model.matrix(~ age + sex + radiation + chemo,
                                 cohort)[, -1])
summary(fg)

# Both are reported: they answer different clinical questions.
Publication
View on ResearchGate
Read publication ↗