Stroke Neurology · Int J Neuroscience · 2026
Thrombolysis After the Window Closes
The Scenario
The 4.5-hour thrombolysis window leaves many stroke patients on the wrong side of the clock. The trials that pushed past it used different doses and selection rules, and they disagree.
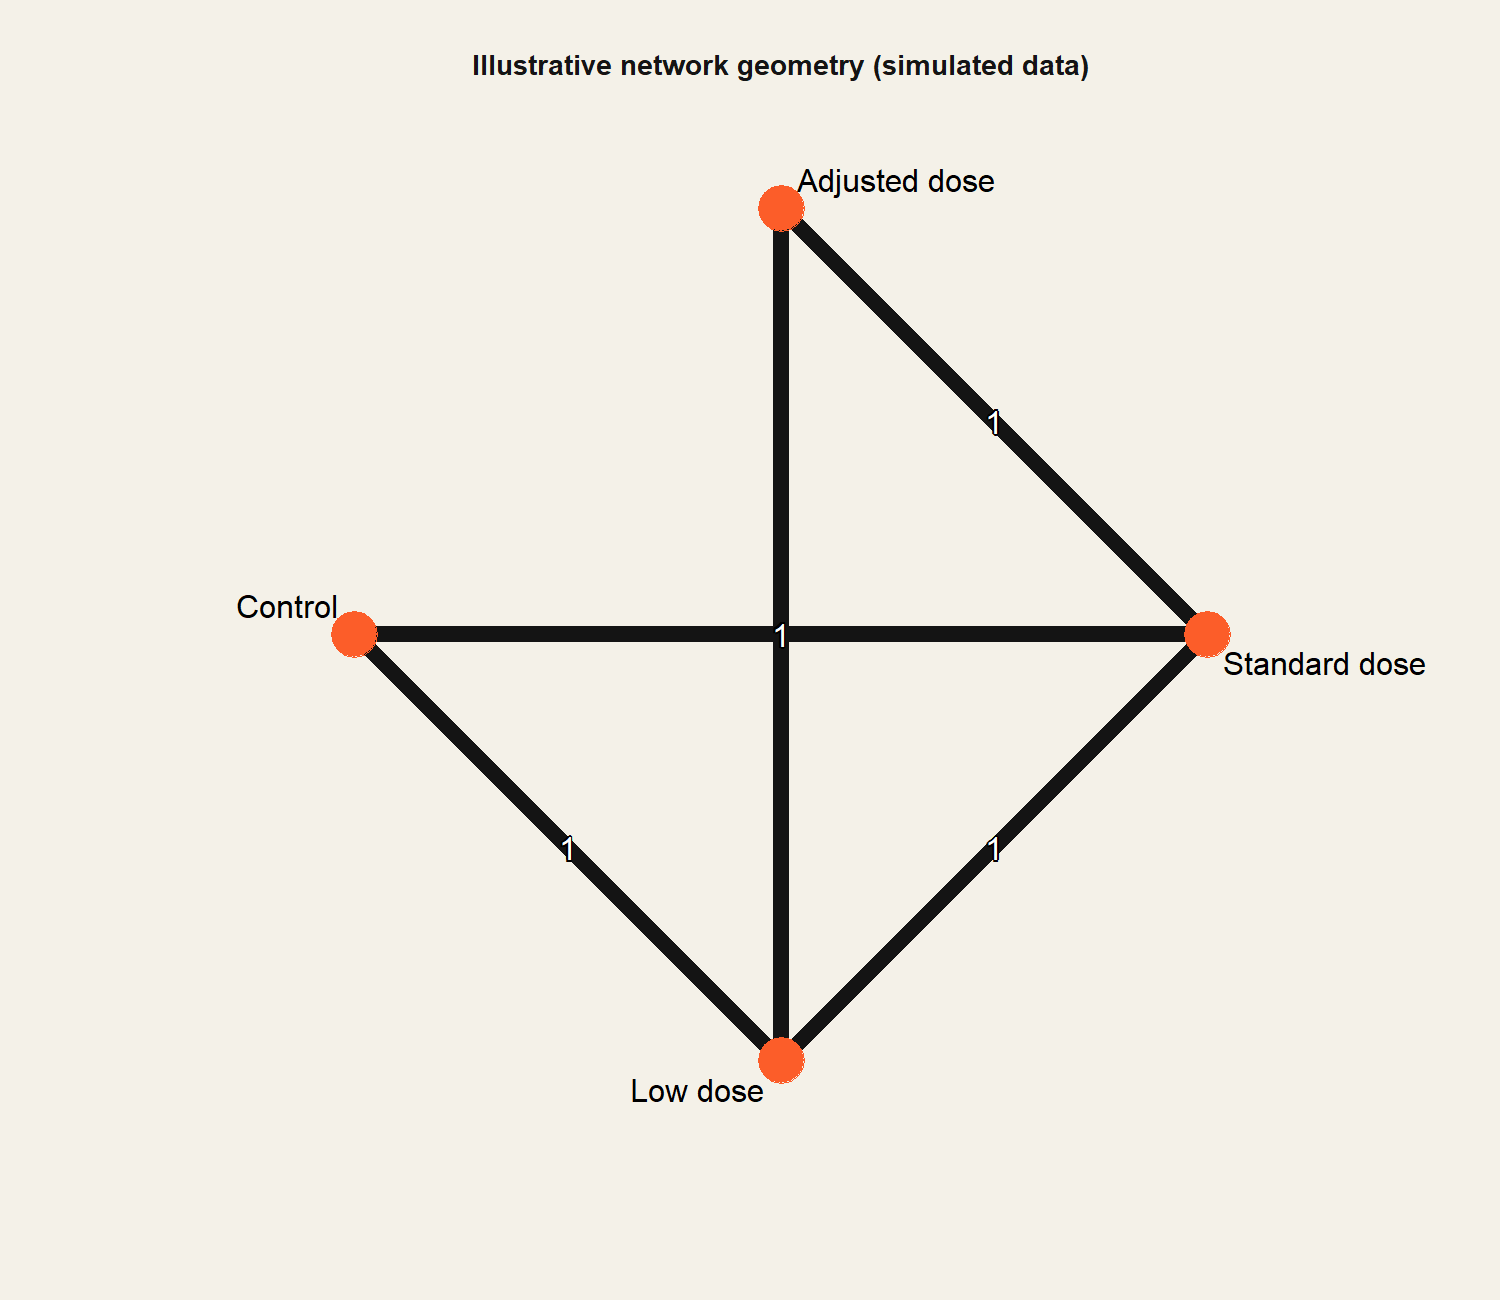
No single pairwise comparison could answer whether late alteplase helps and at what dose. The dosing regimens had never all met in one trial, so the comparison had to run through a network.
From Question to Answer
Clinical question
Beyond 4.5 hours, does alteplase still help, and does the dose matter?
The evidence
Late-window and wake-up stroke RCTs with inconsistent arms and doses
The design
One network, estimated twice: frequentist and Bayesian, with GRADE certainty on every comparison
The answer
Functional benefit with a quantified bleeding cost, published with certainty ratings attached
The Decisions That Mattered
A network, because the doses never met in one trial.
Network meta-analysis borrows strength through shared control arms, so regimens compared only indirectly still get an estimate.
The same network estimated in two frameworks.
The frequentist model ran in netmeta, the Bayesian model in gemtc with MCMC. When two philosophies of inference agree, the result is not an artifact of either.
GRADE certainty attached to each comparison.
A pooled estimate without a certainty rating invites overconfidence. Clinicians got both the number and how much to trust it.
Arm-level quality control before any model ran.
Scripted checks on every trial arm caught mislabeled arms and a double-counted trial in the source literature. The model is only as good as the network it sits on.
Overview
Problem
Late-window thrombolysis evidence is fragmented across doses and trial designs that never met head to head.
Approach
Dual-framework network meta-analysis (netmeta and gemtc MCMC) with GRADE and scripted arm-level QC.
Outcome
Published in The International Journal of Neuroscience, March 2026. An independent reproduction audit later re-derived the published estimates exactly.
Figures
Reproducible R Code
Two frameworks, one network
# Frequentist side
pw  <- pairwise(treat, event = events, n = total,
                studlab = study, data = arms, sm = "RR")
net <- netmeta(pw, random = TRUE, reference.group = "Control")
netgraph(net); netrank(net)

# Bayesian side: same network, different engine
mtc <- mtc.network(arm_data)
mod <- mtc.model(mtc, likelihood = "binom", link = "log")
res <- mtc.run(mod)          # MCMC
summary(res)

# Agreement between the two frameworks is the robustness check.
Publication
View on ResearchGate
Read publication ↗