Hematologic Oncology · Blood (ASH) · 2025
Is a Second Transplant Worth It?
The Scenario
When leukemia or lymphoma relapses after a stem cell transplant, the hardest question in the room is whether a second transplant is worth it.
The transplant team had years of charts and no synthesized answer. My job was to turn that cohort into survival evidence a clinician can act on: who benefits, who does not, and what the procedure itself costs in mortality.
From Question to Answer
Clinical question
Does a second transplant extend survival, and for which patients?
The evidence
A single-center retrospective cohort with correlated transplant variables
The design
Cox modeling with collinearity and discrimination diagnostics; procedure mortality separated from disease mortality
The answer
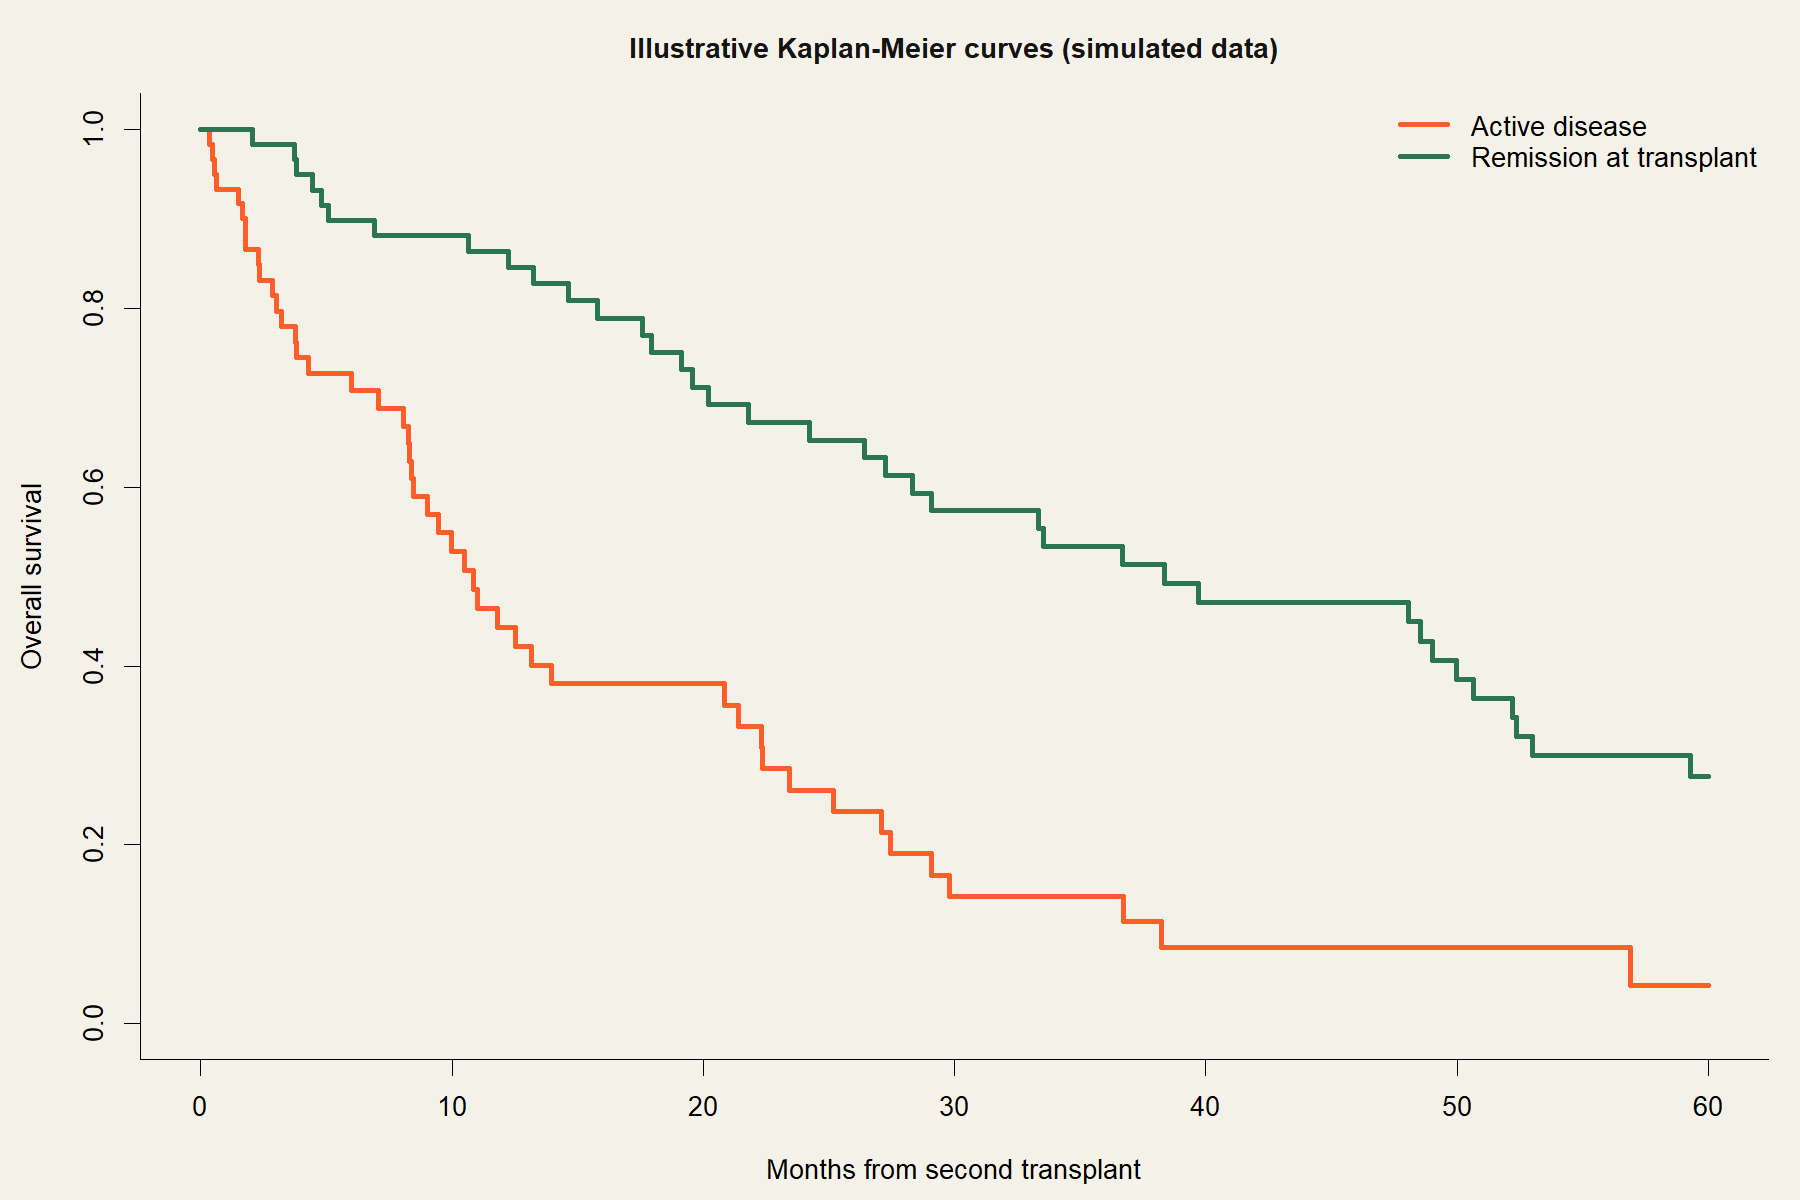
Survival differs sharply by disease status at transplant; published in Blood
The Decisions That Mattered
Collinearity screening before any hazard ratio was reported.
Transplant variables travel together: disease status, conditioning, donor type. Variance inflation factors decided what the Cox model could honestly hold at once.
Discrimination reported alongside the model, not just p-values.
Harrell's C tells the reader whether the model actually separates patients who live longer from those who do not. A significant coefficient alone does not.
Covariate-adjusted survival curves for the headline comparison.
Raw Kaplan-Meier curves compare groups that differ in more than the thing you care about. Adjusted curves compare like with like.
Transplant-related mortality analyzed on its own.
Patients need to know whether deaths came from the procedure or the disease. Folding them together hides the answer they are really asking for.
Overview
Problem
Relapsed lymphoma and leukemia after a first transplant, with no synthesized survival evidence for the second.
Approach
Kaplan-Meier and Cox models with VIF screening, Harrell's C, adjusted curves, and a separate transplant-related mortality analysis.
Outcome
Published in Blood, November 2025, first author. Mine end to end, from protocol and case report forms through the revision cycle.
Figures
Reproducible R Code
Cox model with diagnostics
# Screen candidate covariates for collinearity first
car::vif(lm(dummy_outcome ~ disease_status + conditioning + donor_type,
            data = cohort))

# Cox model on what survives the screen
fit <- coxph(Surv(time_months, died) ~ disease_status + age + donor_type,
             data = cohort)
summary(fit)          # HRs with 95% CIs
concordance(fit)      # Harrell's C: does it discriminate?

# Adjusted survival curves for the headline figure
ggadjustedcurves(fit, variable = "disease_status", data = cohort)

# Transplant-related mortality, kept apart from relapse deaths
trm <- coxph(Surv(time_months, trm_event) ~ disease_status + age,
             data = cohort)
Publication
Read in Blood
Read publication ↗